Customer Story: How Arup solved their IT infrastructure challenges with our ServiceNow Monitoring MP
Arup are a global architectural engineering company, behind ground-breaking structures such as: Sydney Opera House, Changi Airport Singapore, Hong Kong Zhuhai-Macau Bridge, and many more.
Behind these amazing projects sits a large IT infrastructure, spanning 44 countries, across 3 key regions Americas, UKIMEA & APAC. We worked closely with Anthony Ashmead – Enterprise Monitoring Consultant at Arup, to identify key performance and usability issues with ServiceNow when accessed from key remote sites and better connect SCOM and ServiceNow as part of Arup's fully integrated, end-to-end monitoring system.
History: Migration from regional, localized monitoring to a global operating system
The initial challenge was a well-known problem ‘tool sprawl’! As in many businesses, Arup were using a range of monitoring solutions:
OnPrem Multi Cloud (Azure/AWS)
Different monitoring tools in regional IT teams (SolarWinds/PAMonitor/SCOM)
Native tools for platforms (OCOM/Vcentre/VROps, etc)
Arup needed an overarching enterprise monitoring tool, capable of integrating all their regional tools and systems into one centralised place – so they used SCOM, coupled by ServiceNow for their global ITSM. This meant that regional offices and users could continue to use localised tools; keeping these teams upskilled, happy and engaged in the process of moving to a fully integrated solution.
But, as with many large migration projects, they faced some challenges along the way.
The challenges of delivering a fully integrated, end-to-end monitoring system
It soon became clear that SCOM and ServiceNow would not provide enough integration, visibility or granularity of data, to clearly understand & monitor issues on a global scale.
Arup experienced significant issues with latency, time-outs and slow page loading in 4 key regions: London, Amsterdam, Australia & North Europe. Despite users in these regions consistently reporting issues, ServiceNow was not flagging any problems; instead ServiceNow’s performance metrics where ‘green’ and in theory full support was being provided.
Rightly-so, Arup concluded the problem must be a localized issue in their network.
How to avoid inefficient, time-consuming, trouble-shooting!
Arup needed to understand, monitor, and test what was happening at a local level. But, as we all know time can be easily consumed by trouble-shooting local apps, investigating individual user systems, and generally shooting in the dark for a solution!
So, they let our ServiceNow Monitoring MP do the hard work for them!
Cookdown were able to take out all the hard work out of this process, with a quick and easy to integrate solution! We worked with Arup to implement a new monitor to deliver greater visibility of Arup’s ServiceNow incidents, so they could get straight to the root of the problem - our ServiceNow Monitoring MP was set up and configured in less than a day!
How does The ServiceNow Monitoring MP work?

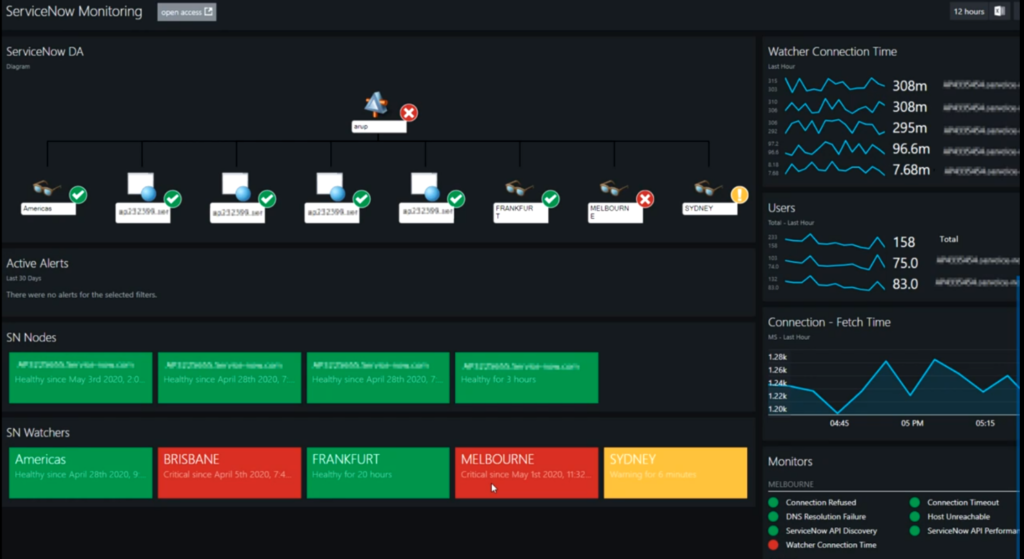
Firstly, we discover a distributed application in SCOM which creates incidents in our Cookdown Monitoring tool. As you can see from the diagram below, this is underpinned by two nodes, which run ServiceNow in the cloud. We then setup watchers from SCOM agents in each region/site, to observe ServiceNow from where the users are experiencing the problem –this provided Arup with a much greater level of detail.

Our ServiceNow Monitoring MP enabled them to implement a Connection Time Monitor, with the following thresholds:
Latency <150ms the monitor flags ‘GREEN’
Latency 150-300ms the monitor flags ‘AMBER’
Latency >300ms the monitor flags ‘RED’
Our ServiceNow Monitoring MP also provides a range of additional functions:
Alerts can be easily configured to flag (RAG) for issues of varying degrees/levels
Alerts can be set to auto-heal
Alerts can be customised based on priority or severity of the issue
Here are the properties of the Connection Time Monitor that are configurable via override:

Arup are also using a dashboard from our sister company, SquaredUp, to visualize their SCOM data. This provides an easy to use platform for reviewing data on their system health and performance, below you can see how they configured it to look at individual nodes and watchers, to see how many users are being affected by regional issues.
What else can our ServiceNow Monitoring MP do?
Although these challenges might be unique to Arup, our ServiceNow Monitoring MP, can help solve a multitude of issues with the ability to monitor and drill down into the following areas:
Connection refused
Connection Timeout
DNS Resolution Failure
Host Unreachable
ServiceNow API Discovery
ServiceNow API Performance
Watcher Connection Time
Great news, there’s a new version of our ServiceNow Monitoring MP available now!
If you think your business could benefit from these quick fixes, good news the latest version of our ServiceNow Monitoring MP is totally free and can be downloaded here.
And, we’ve just added Orlando support to this version too.
Want to find out more?
Check out our webinar on ServiceNow Monitoring in Practice – watch now!